|
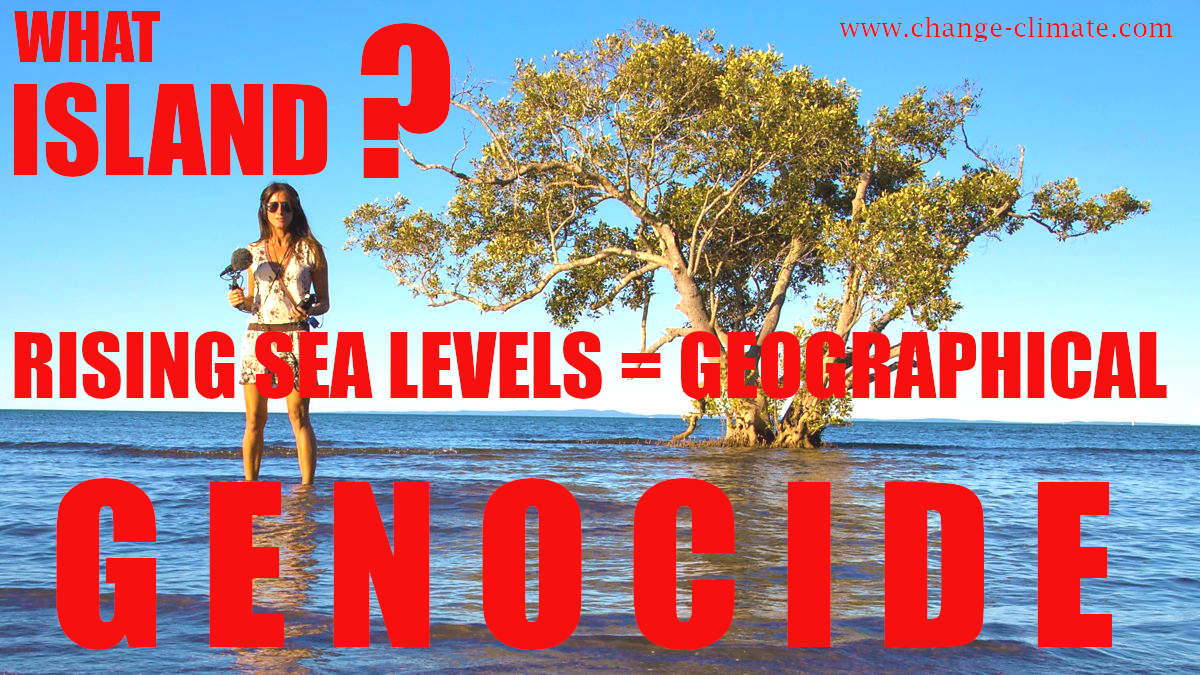
GEOGRAPHICAL
GENOCIDE - Genocide is linked to Eugenics
and Discrimination, in its most extreme form. Examples range from local
authorities persecuting poorer members of society, where they only
want wealthy residents who pay higher taxes, etc. To full on
and systematic industrial scale annihilation, such as the Holocaust.
Cases could be tried by the International Criminal Court on their own
merits, using common sense analogy. For example, where gassing of people
during the Holocaust was systematic industrial scale annihilation. That
is far worse in concept, than pumping CO2 into the atmosphere in total
disregard for the consequences of global warming. As it is known to
cause sea level rise, that would ultimately result in the drowning of
islanders, displacement, and loss of natural habitat. Hence, the level
of inhumanity may be less, but the resultant loss of life and mental
torture, is on a scale that it classes as Genocide.
As
you drive down the road to your local supermarket in your
petrol and
diesel gas guzzlers, switch on your electric
kettle powered by coal generating
stations, or hear your gas
central heating spark up, spare a thought for the polar bears and islanders
you are making homeless, as global
warming melts the ice caps, and the melting ice raises ocean levels
to flood low lying island homes.
ISLAND
NATIONS UNDER THREAT - A TO Z
1.
Cabo
Verde, Republic of
2.
Carteret Islands
3.
Fiji, Republic of
4.
Ireland
5.
Hawaii
6. Japan
7.
Kiribati
8.
Maldives
9.
Marshall
Islands, Republic of the
10.
Micronesia,
Federated States of
11.
Palau
12.
Sarichef Island
13.
Seychelles
14. Solomon Islands
15.Tangier Island
16.
Torres Strait Islands
17.
Tuvalu
18.
United Kingdom
THE GUARDIAN MARCH 2020
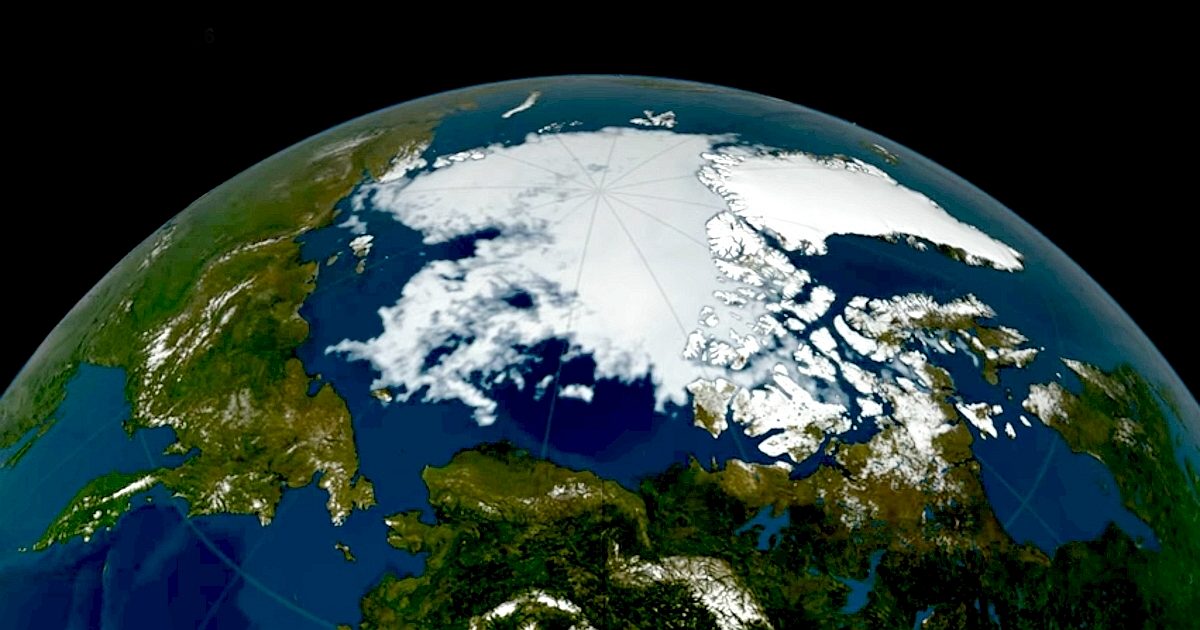
The polar ice caps are melting six times faster than in the 1990s, according to the most complete analysis to date.
The ice loss from Greenland and Antarctica is tracking the worst-case climate warming scenario set out by the Intergovernmental Panel on Climate Change (IPCC), scientists say. Without rapid cuts to carbon emissions the analysis indicates there could be a rise in sea levels that would leave 400 million people exposed to coastal flooding each year by the end of the century.
Rising sea levels are the one of the most damaging long-term impacts of the climate crisis, and the contribution of Greenland and Antarctica is accelerating. The new analysis updates and combines recent studies of the ice masses and predicts that 2019 will prove to have been a record-breaking year when the most recent data is processed.
The previous peak year for Greenland and Antarctic ice melting was 2010, after a natural climate cycle led to a run of very hot summers. But the Arctic heatwave of 2019 means it is nearly certain that more ice was lost last year.
The average annual loss of ice from Greenland and Antarctica in the 2010s was 475bn tonnes – six times greater than the 81bn tonnes a year lost in the 1990s. In total the two ice caps lost 6.4tn tonnes of ice from 1992 to 2017, with melting in Greenland responsible for 60% of that figure.
The IPCC’s most recent mid-range prediction for global sea level rise in 2100 is 53cm. But the new analysis suggests that if current trends continue the oceans will rise by an additional 17cm.
“Every centimetre of sea level rise leads to coastal flooding and coastal erosion, disrupting people’s lives around the planet,” said Prof Andrew Shepherd, of the University of Leeds. He said the extra 17cm would mean the number of exposed to coastal flooding each year rising from 360 million to 400 million. “These are not unlikely events with small impacts,” he said. “They are already under way and will be devastating for coastal communities.”
Erik Ivins, of Nasa’s Jet Propulsion Laboratory, in California, who led the assessment with Shepherd, said the lost ice was a clear sign of global heating. “The satellite measurements provide prima facie, rather irrefutable, evidence,” he said.
Almost all the ice loss from Antarctica and half of that from Greenland arose from warming oceans melting the glaciers that flow from the ice caps. This causes glacial flow to speed up, dumping more icebergs into the ocean. The remainder of Greenland’s ice losses are caused by hotter air temperatures that melt the surface of the ice sheet.
The combined analysis was carried out by a team of 89 scientists from 50 international organisations, who combined the findings of 26 ice surveys. It included data from 11 satellite missions that tracked the ice sheets’ changing volume, speed of flow and mass.
About a third of the total sea level rise now comes from Greenland and Antarctic ice loss. Just under half comes from the thermal expansion of warming ocean water and a fifth from other smaller glaciers. But the latter sources are not accelerating, unlike in Greenland and Antarctica.
Shepherd said the ice caps had been slow to respond to human-caused global heating. Greenland and especially Antarctica were quite stable at the start of the 1990s despite decades of a warming climate.
Shepherd said it took about 30 years for the ice caps to react. Now that they had a further 30 years of melting was inevitable, even if emissions were halted today. Nonetheless, he said, urgent carbon emissions cuts were vital. “We can offset some of that [sea level rise] if we stop heating the planet.”
The IPCC is in the process of producing a new global climate report and its lead author, Prof Guðfinna Aðalgeirsdóttir, of the University of Iceland, said: “The reconciled estimate of Greenland and Antarctic ice loss is timely.”
She said she also saw increased losses from Iceland’s ice caps last year. “Summer 2019 was very warm in this region.”
By Damian Carrington Environment editor
SIX
(SUGGESTED) STEPS TOWARD A COOLER PLANET
1.
TRANSPORT:
Phase out polluting vehicles.
Governments aim to end the sale of new petrol,
and diesel
vehicles by 2040 but have no infrastructure plan to support such
ambition. Such infrastructure should exceed the performance of fossil
fuel filling stations, prolong EV
battery life and provide power grids with a measure of load leveling.
Any such system should seek to obviate the provision of millions of fast
charge points where implementation could prove to be a logistical
nightmare. This may involve international agreement as to energy storage
format and statute to steer car makers to collaborate in part in a world
of competition.
Marine
transport can be carbon
neutral given the right policies, with phased transition in specific
stages such as not to unduly penalize present investment in LNG
shipping
and other recent MARPOL
compliant IC
powered vessels. Future cargo vessel should be at least in part powered
by renewable energy, on the road to zero
carbon, making allowances for technology catch-up.
Air
travel powered by kerosene should attract hefty mitigation offset, where
low carbon alternatives should be encouraged.
2.
RENEWABLES:
Renewable
energy should replace carbon-based fuels (coal,
oil and
gas)
in our electricity for homes, factories, heating and transport. Coal
and nuclear
power plants should be phased out.
3.
HOUSING:
On site micro or macro
generation is the best option, starting with new build homes that are
both affordable and sustainable by design to replace crumbling housing
stocks. Encourage building in timber
to provide carbon lock from a renewable natural resource. Make
sustainable housing a permitted development, taking out the need to
apply for planning permission, will cut out council blockers from the
decision making process, to stamp out empire building agendas.
4.
AGRICULTURE:
We need to grow more trees
to absorb carbon emissions from a growing
population, air travel, and to build new homes. We should promote
reductions in food waste and eating of foods that use less energy to
produce. Educating children on these matters in schools and via
campaigns such as no
meat Mondays, should be part of ordinary study.
5.
INDUSTRY:
Factories should be aiming for solar heating and onsite renewable energy
generation. EV parking and even service facilities should be part of new
industrial estates as part of any building permissions.
6.
POLITICS:
- National governing bodies need
to adopt rules to eliminate administrative wastages, to include scaling
down spending on war machines, increasing spend on educating the public
and supporting sustainable social policies that mesh with other
cultures. This includes fostering policies and making funds available to
close links in the technology chain to make up for lost time. Kleptocratic
empire building must cease in the search for natural equilibrium.
CLIMATE
CHANGE COP HISTORY
|
1995
COP 1, BERLIN, GERMANY
1996
COP 2, GENEVA, SWITZERLAND
1997
COP 3, KYOTO, JAPAN
1998
COP 4, BUENOS AIRES, ARGENTINA
1999
COP 5, BONN, GERMANY
2000:COP
6, THE HAGUE, NETHERLANDS
2001
COP 7, MARRAKECH, MOROCCO
2002
COP 8, NEW DELHI, INDIA
2003
COP 9, MILAN, ITALY
2004
COP 10, BUENOS AIRES, ARGENTINA
2005
COP 11/CMP 1, MONTREAL, CANADA
2006
COP 12/CMP 2, NAIROBI, KENYA
2007
COP 13/CMP 3, BALI, INDONESIA |
2008
COP 14/CMP 4, POZNAN, POLAND
2009
COP 15/CMP 5, COPENHAGEN, DENMARK
2010
COP 16/CMP 6, CANCUN, MEXICO
2011
COP 17/CMP 7, DURBAN, SOUTH AFRICA
2012
COP 18/CMP 8, DOHA, QATAR
2013
COP 19/CMP 9, WARSAW, POLAND
2014
COP 20/CMP 10, LIMA, PERU
2015
COP 21/CMP 11, Paris, France
2016
COP 22/CMP 12/CMA 1, Marrakech, Morocco
2017
COP 23/CMP 13/CMA 2, Bonn, Germany
2018
COP 24/CMP 14/CMA 3, Katowice, Poland
2019
COP 25/CMP 15/CMA 4, Santiago, Chile
2020
COP 26/CMP 16/CMA 5, UK contenders |
DESERTIFICATION COP HISTORY
|
COP 1: Rome, Italy, 29
Sept to 10 Oct 1997
|
COP 9: Buenos Aires,
Argentina, 21 Sept to 2 Oct 2009
|
|
COP 2: Dakar,
Senegal, 30
Nov to 11 Dec 1998
|
COP 10: Changwon, South
Korea, 10 to 20
Oct 2011
|
|
COP 3: Recife, Brazil, 15 to 26
Nov 1999
|
COP 11: Windhoek,
Namibia, 16 to 27
Sept 2013
|
|
COP 4: Bonn, Germany, 11 to 22
Dec 2000
|
COP 12: Ankara, Turkey, 12 to 23
Oct 2015
|
|
COP 5: Geneva,
Switzerland, 1 to 12
Oct 2001
|
COP 13: Ordos City,
China, 6 to 16
Sept 2017
|
|
COP 6: Havana, Cuba, 25 August to 5
Sept 2003
|
COP 14: New Delhi, India, 2 to 13
Sept 2019
|
|
COP 7: Nairobi, Kenya, 17 to 28
Oct 2005
|
COP 15: 2020
|
|
COP 8: Madrid, Spain, 3 to 14
Sept 2007
|
COP 16: 2021
|
BIODIVERSITY
COP HISTORY
|
COP
1: 1994 Nassau,
Bahamas, Nov & Dec
|
COP
8: 2006
Curitiba, Brazil, 8 Mar
|
|
COP
2: 1995
Jakarta, Indonesia, Nov
|
COP
9: 2008 Bonn,
Germany, May
|
|
COP
3: 1996 Buenos
Aires, Argentina, Nov
|
COP
10: 2010
Nagoya, Japan, Oct
|
|
COP
4: 1998
Bratislava, Slovakia, May
|
COP
11: 2012
Hyderabad, India
|
|
EXCOP:
1999 Cartagena, Colombia, Feb
|
COP
12: 2014
Pyeongchang, Republic of Korea, Oct
|
|
COP
5: 2000
Nairobi, Kenya, May
|
COP
13: 2016
Cancun, Mexico, 2 to 17 Dec
|
|
COP
6: 2002 The
Hague, Netherlands, April
|
COP
14: 2018
Sharm El-Sheikh, Egypt, 17 to 29 Nov
|
|
COP
7: 2004 Kuala
Lumpur, Malaysia, Feb
|
COP
15: 2020 Kunming, Yunnan, China
|
UN
CLIMATE ACTION PORTFOLIOS 1.
Finance
2. Energy
Transition
3. Industry
Transition
4. Nature-Based
Solutions
5. Cities and Local
Action
6. Resilience and
Adaptation
7. Mitigation
Strategy
8. Youth Engagement
& Public Mobilization
9. Social and Political
Drivers
THE
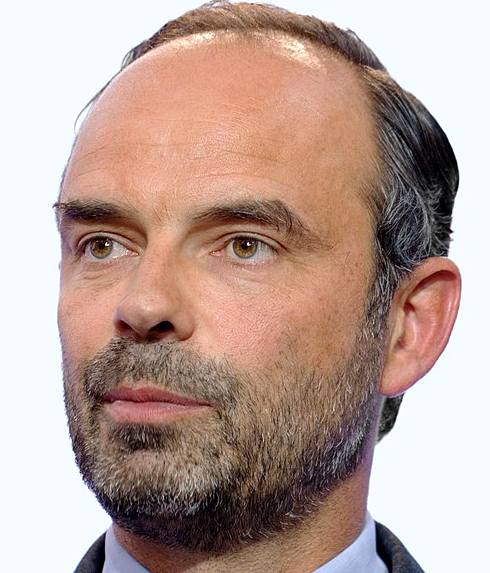
G20 HOT HEADS
|
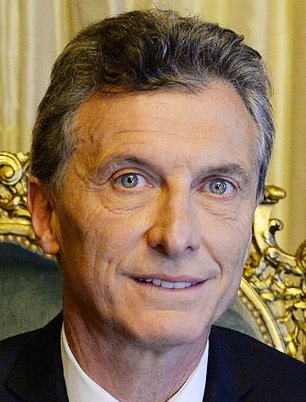
ARGENTINA
|
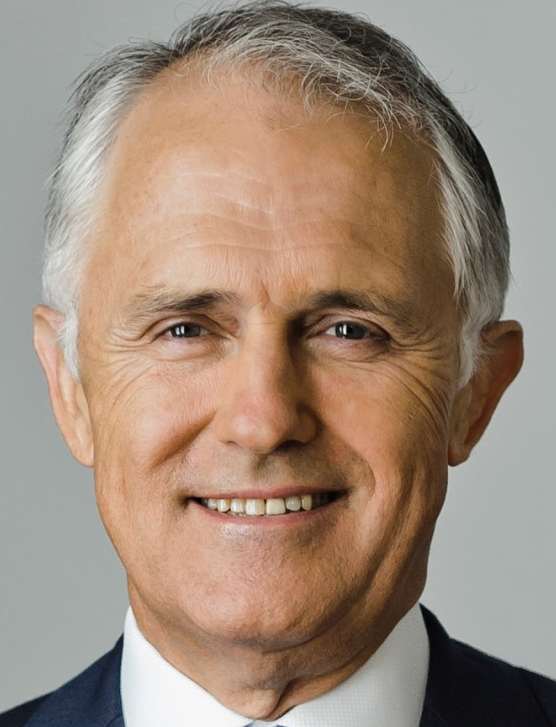
AUSTRALIA
|

BRAZIL
|

CANADA
|
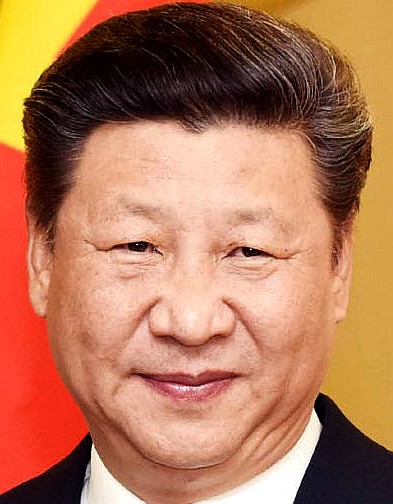
CHINA
|
|
EUROPEAN
UNION
|
FRANCE
|

GERMANY
|

INDIA
|
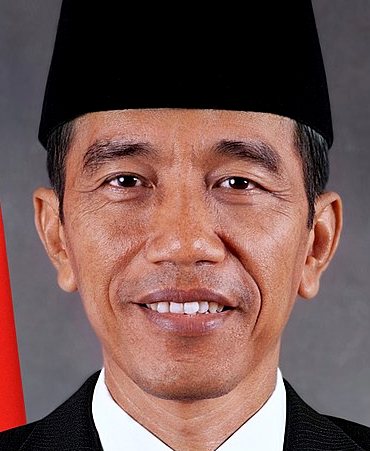
INDONESIA
|
|
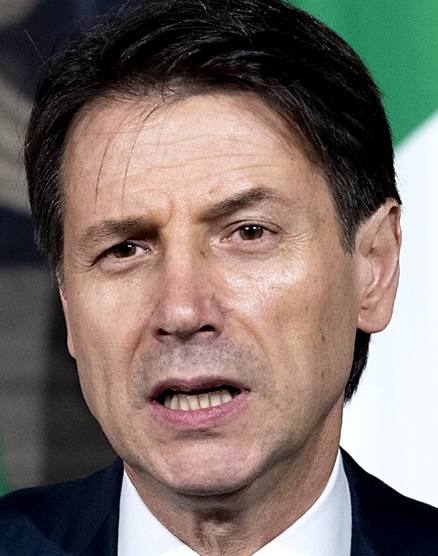
ITALY
|
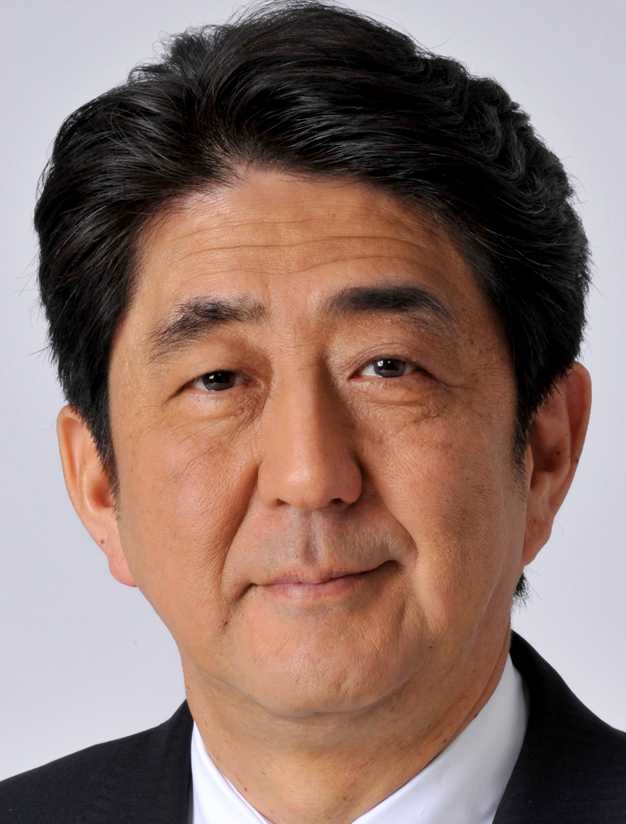
JAPAN
|

MEXICO
|

RUSSIA
|

SAUDI
ARABIA
|
|
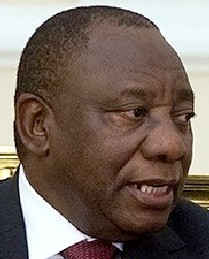
SOUTH
AFRICA
|
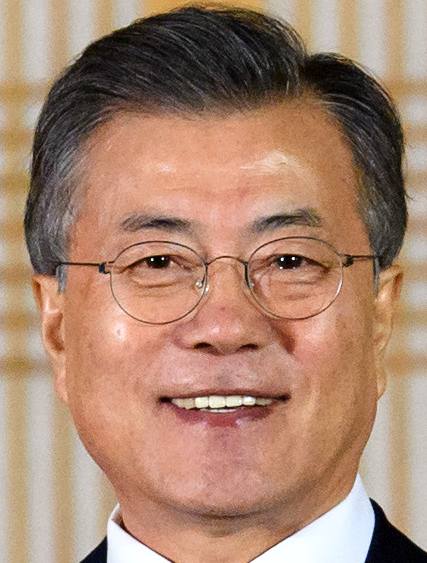
SOUTH
KOREA
|

TURKEY
|

UNITED
KINGDOM
|

UNITED
STATES
|
MEET
THE FOCKERS
- May God have mercy on their souls.
WHAT
ARE THEY LIKE?
- Life on earth is being annihilated by the policies of
the most powerful leaders on the planet. The sad fact is that
you elected them. That makes you responsible. You voted in the
politicians who said one thing to get elected, and then did
another. Their agenda is getting re-elected rather than doing
what they promised the voters. It is illegal to cause harm to
another human such as to displace a culture, under the Paris Statute
1998, of the International Criminal Court. See also the Genocide
Convention. As the G20 pursue riches and growth, they are going to wish
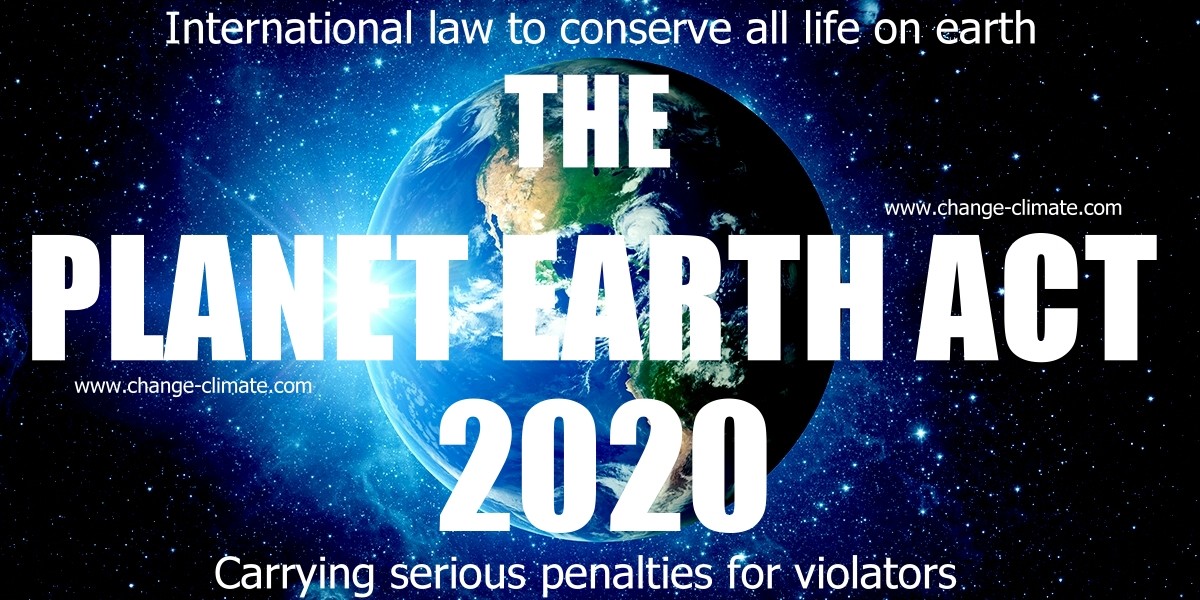
they had listened to the call for the Planet Earth Act 2020. They may
find themselves on the menu,
or succumb to lung
cancer.
LINKS
& REFERENCE
https://theanthropocene.org/film/
https://www.theguardian.com/environment/2016/aug/29/declare-anthropocene-epoch-experts-urge-geological-congress-human-impact-earth
https://www.smithsonianmag.com/science-nature/what-is-the-anthropocene-and-are-we-in-it-164801414/
http://anthropocene.info/
https://en.wikipedia.org/wiki/Anthropocene
|